Executive Dashboard Overview
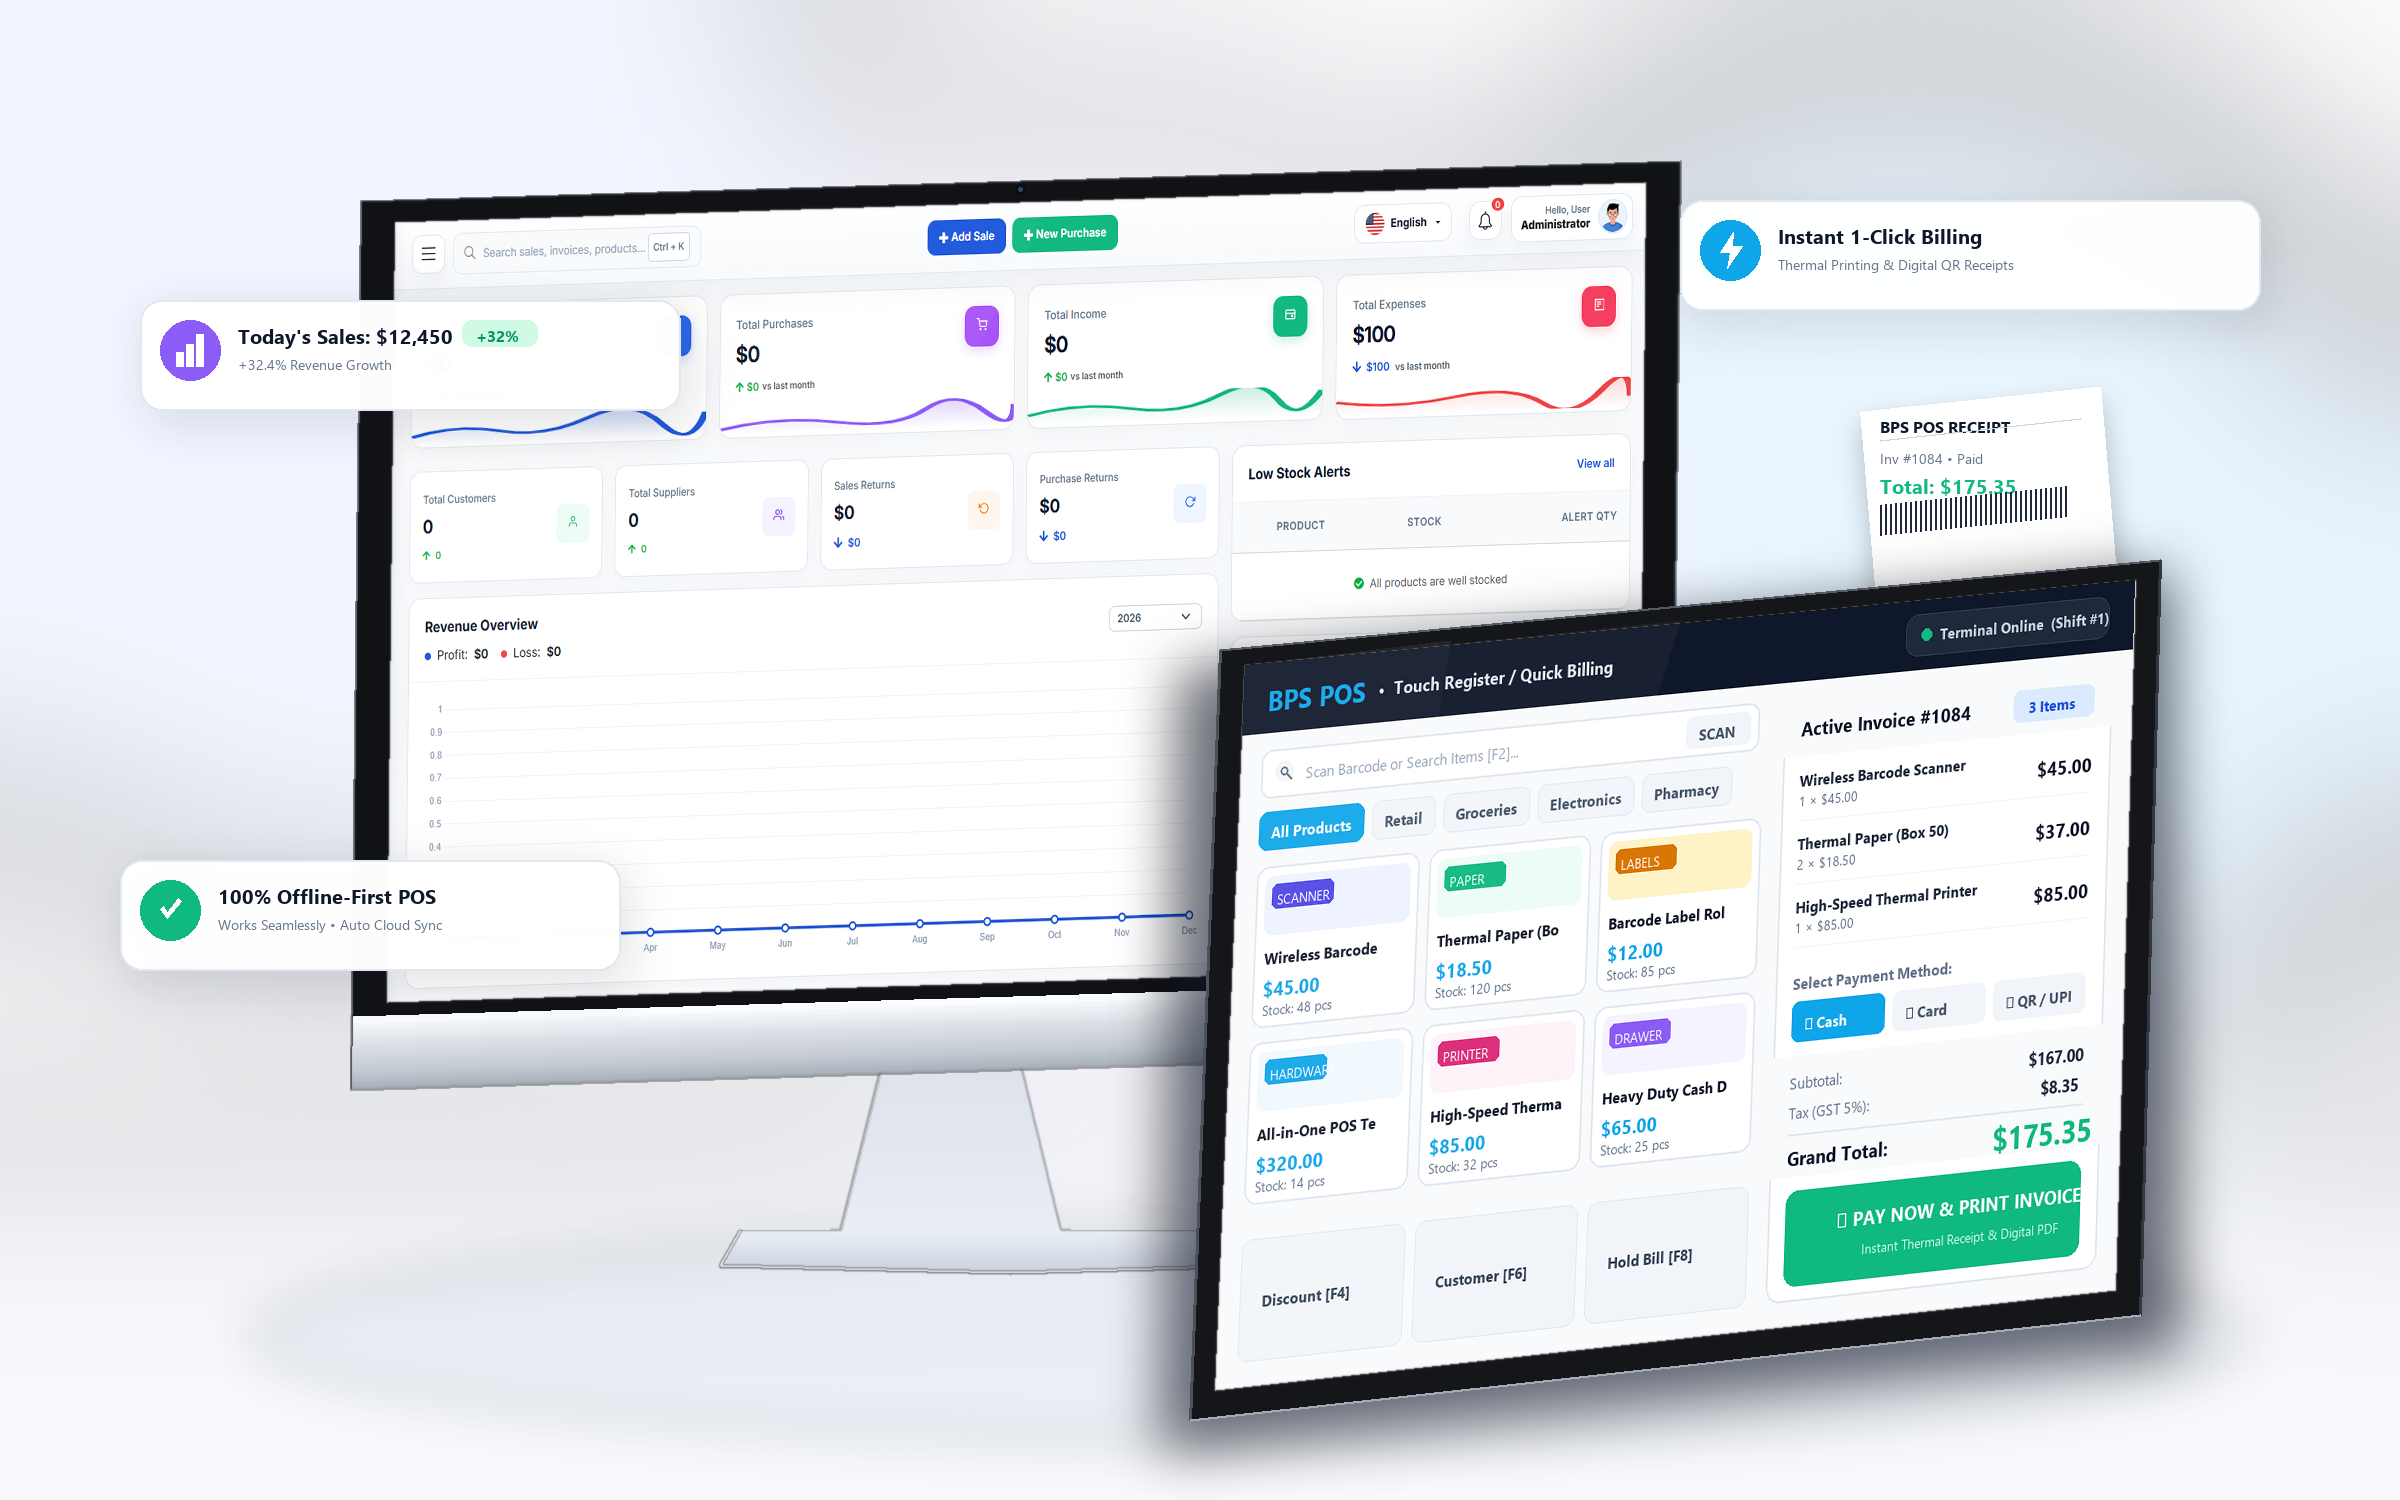
The BPS POS Dashboard serves as the mission control center for your retail business. It aggregates data across your point of sale terminals, central inventory, customer receivables, and supplier payables into clear visual KPI cards, interactive trend graphs, and automated low-stock warnings in real time.
As a business owner or store manager, you need instant clarity on daily revenue, gross margins, and inventory health without generating complex manual spreadsheets. The BPS POS dashboard calculates your financial standing automatically.
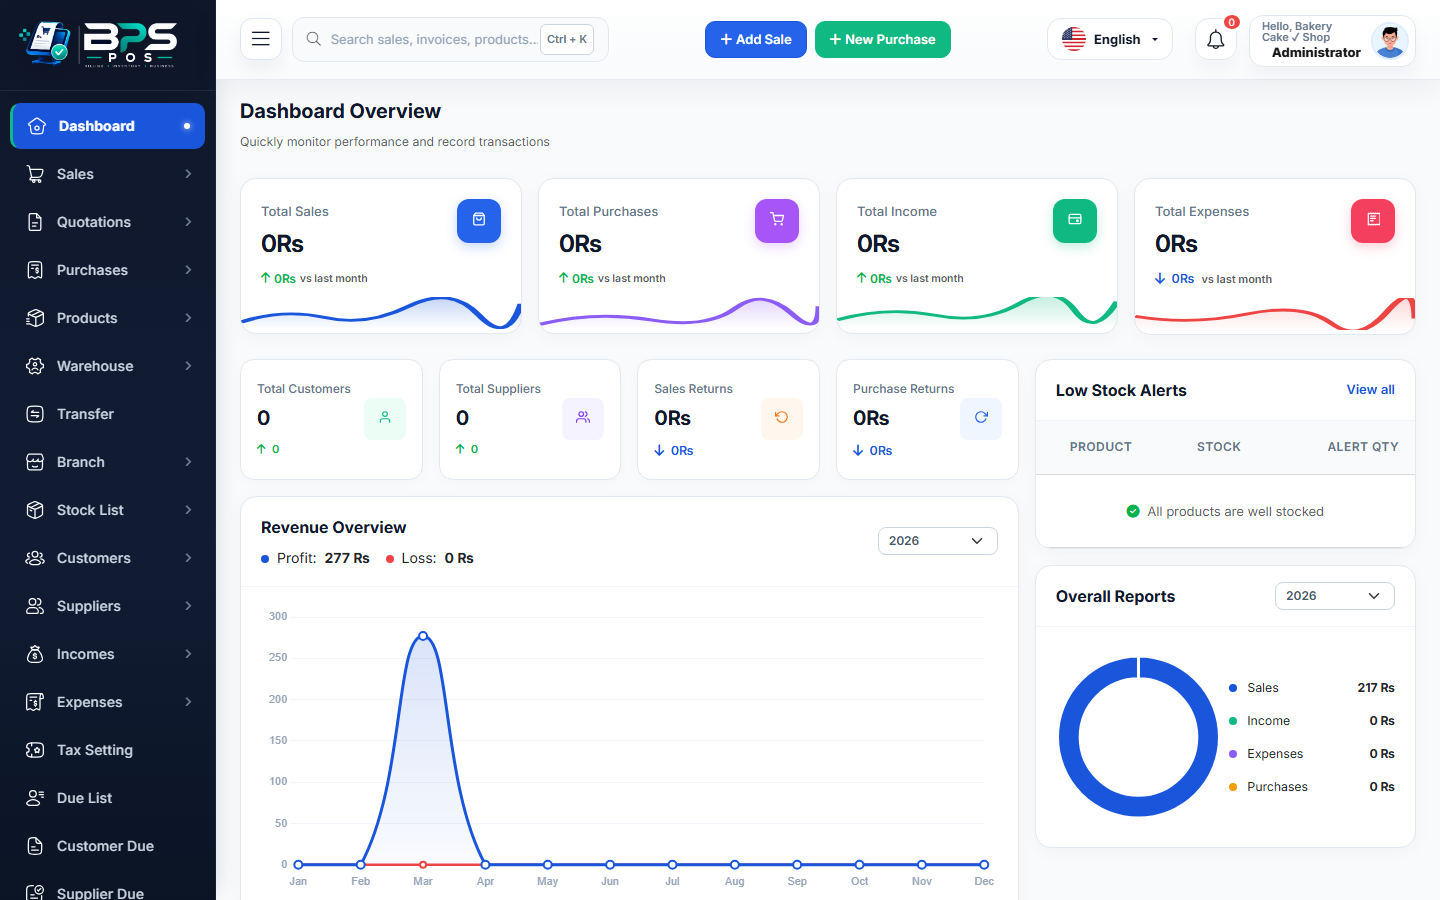
Figure 1: Real-time BPS POS Dashboard showing Sales, Purchases, Stock Value, and Revenue Trends.
1. Understanding the Core KPI Summary Cards
Total Sales
Total gross revenue generated across all POS checkout counters during the selected date range.
Total Purchases
Total procurement expenditure on stock inward received from suppliers.
Customer Dues
Total credit (Udhar) balance pending collection from regular and wholesale customers.
Supplier Payables
Total outstanding balance owed to vendors for credit purchases.
Stock Valuation
Total calculated purchase cost value of current shelf inventory.
Incomes & Expenses
Net operational cash flow tracking direct revenues and shop utility expenses.
2. Visual Revenue Statistics & Sales vs Purchases Graph
The interactive chart on the dashboard plots monthly performance curves, enabling store owners to visualize seasonal peak periods, profit margins, and procurement costs at a glance.
3. Low Stock Alerts & Expired Inventory Table
Located in the lower section of the dashboard, the Low Stock Alert table flags products that have breached their minimum reorder point, allowing cashiers and inventory managers to initiate immediate replenishment orders before running out of stock.