Benchmarking retail branches drives healthy competition and reveals underperforming stores. BPS POS Multi-Branch Analytics Suite renders side-by-side comparison charts of sales volume, net profit, and inventory turnover across all locations.
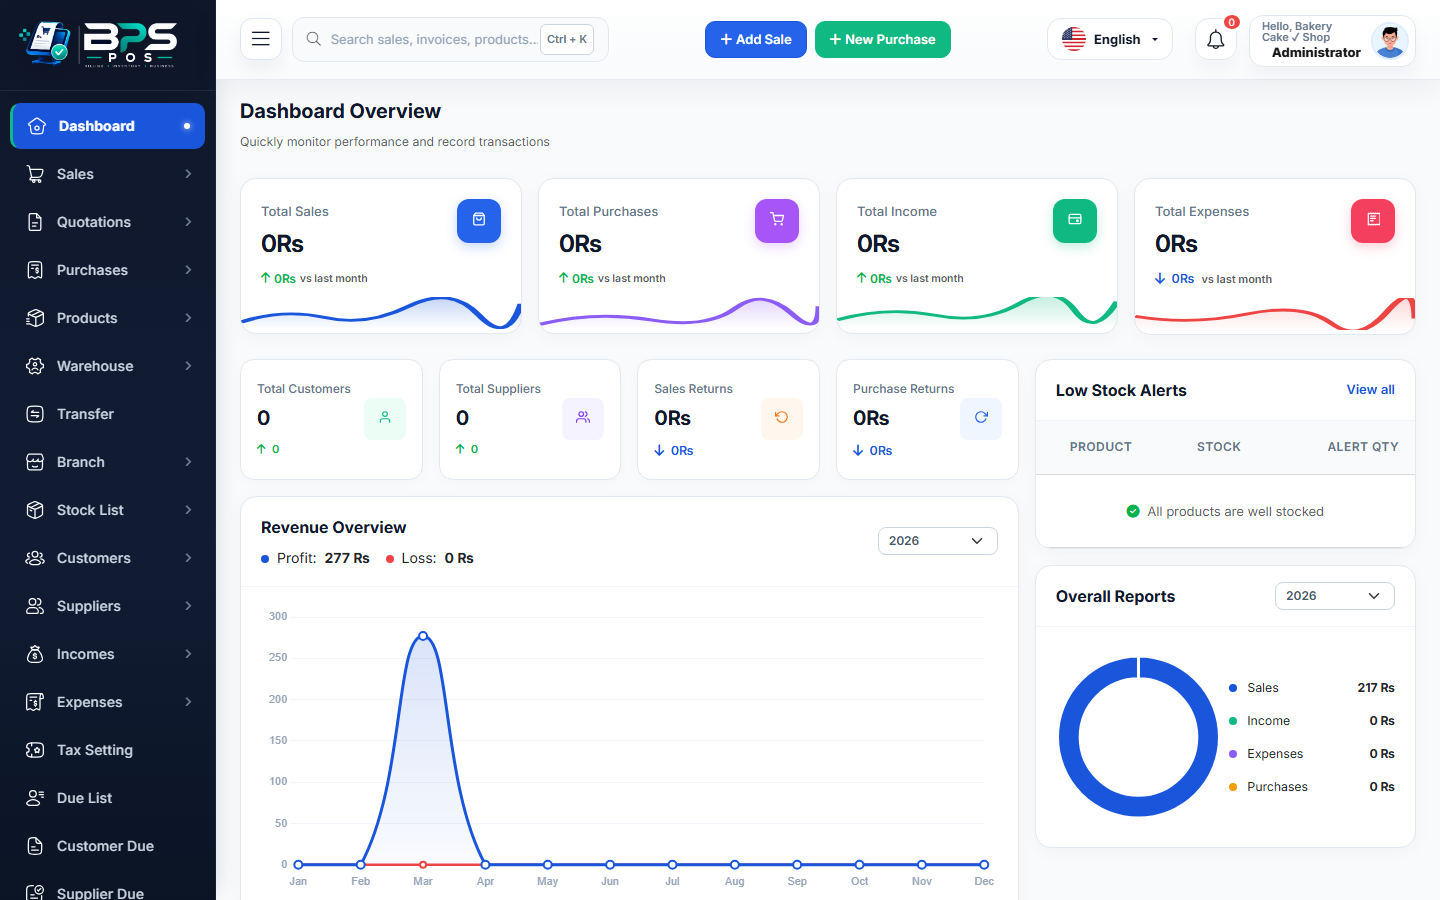
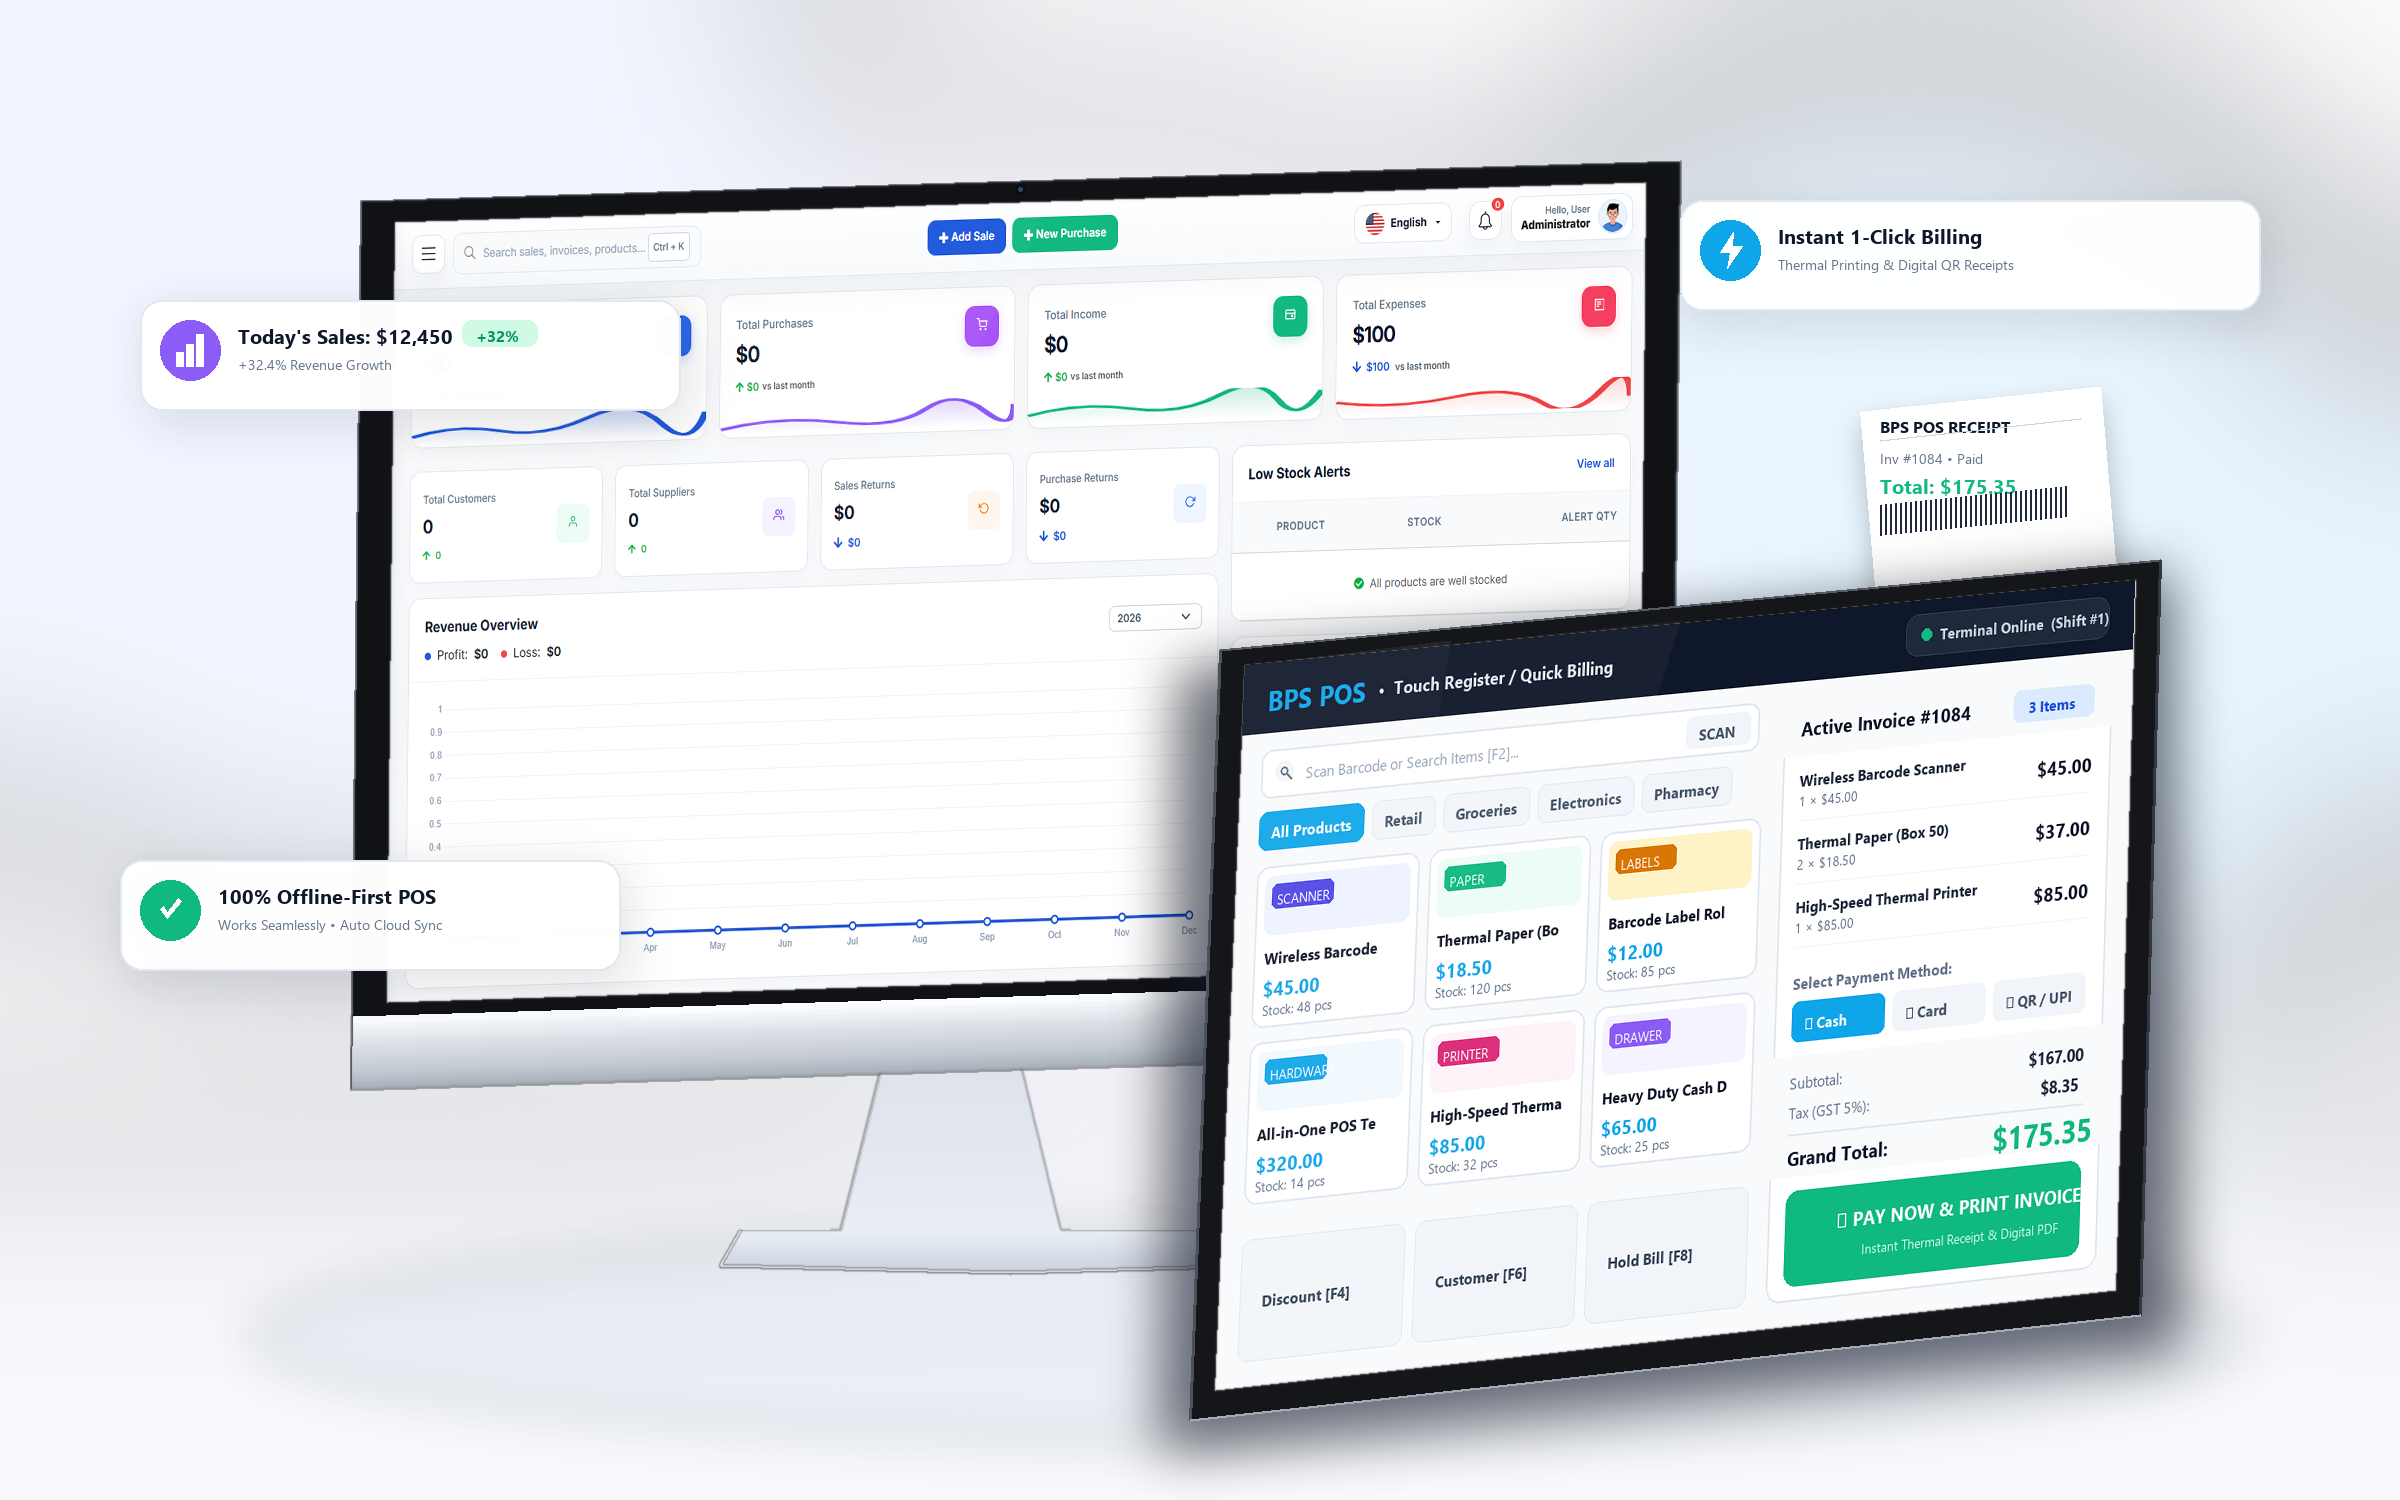
Figure: BPS POS Branch-Wise Sales and Purchase Comparison Analytics in BPS POS.
Generating Branch Comparison Analytics
Follow these step-by-step instructions inside your BPS POS dashboard to configure and operate this workflow seamlessly:
- Go to Reports → Branch Comparison Reports.
- Select Comparison Period: Choose This Month, Quarter, or Year.
- Analyze Bar Charts: Compare Gross Revenue, Discount Percentages, and Net Profit per Location.
- Evaluate Sales per Square Foot / Staff: Measure efficiency across different store sizes and staffing levels.
- Export Comparative Data: Download Excel spreadsheets with side-by-side branch metrics.
BPS POS Pro Tip & Best Practice
Use branch profitability insights to determine whether to renew expensive mall leases or shift focus to suburban drive-thru outlets.
Why This Workflow Matters for Your Business
Lightning-Fast Operations
Eliminate cashier bottlenecks, reduce customer waiting times, and handle peak rush hours effortlessly.
100% Financial Accuracy
Automate tax math, stock deductions, and ledger balances to eliminate human calculation mistakes.
Frequently Asked Questions (FAQs)
Can I compare customer footfall and average bill basket size between branches?
Yes, the report includes Average Order Value (AOV) and Total Bill Count per branch.
Ready to Upgrade Your Retail Billing?
Experience lightning-fast billing, automated stock tracking, and multi-branch control with BPS POS.
Explore Pricing Plans →